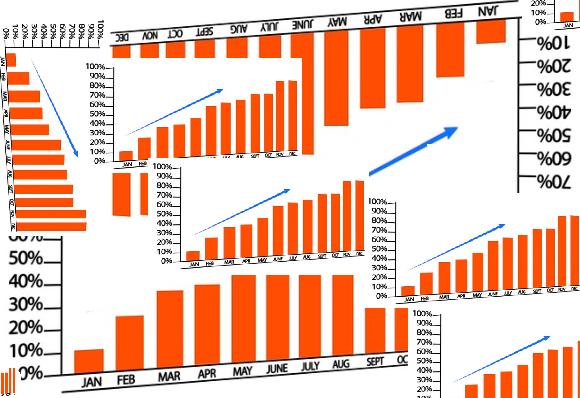
A once-off stack of 10 bar graphs.
Simply provide; The X and Y axis headings, Units and Intervals, and the data points. The colour of the bars and the font type, size and colour. Let us also know the commentary text required to explain the chart and whether it should be left/right/top/bottom of each graph.
More more complex graphs or combined slide packs or recurring orders (for example monthly slide-packs) and specific file delivery formatting (for example PDF, PPT, or online dashboard), please send us an example report of what you need. please contact us.
